

Dr. Chandre Dharmawardana
Professor Kumar David (KD), while claiming that non-fossil energy sources like Solar energy are the best thing that has blessed humanity, continues to claim that they have little applicability to Sri Lanka (see Colombo Telegraph).
KD, writing in the Sunday Island on 2021 August 22 under the title “The 70% Renewables Saga Again” compares it to “Pavithra’s snake oil”. He claims that the 70% electrical energy target for 2030 from renewables that the “President erected in his halcyon days” is a myth that persists even among professional scientists and a few engineers”.
KD is a distinguished engineering academic who has defended the fossil-fuel plans of the CEB and its traditional suppliers. The president’s planners stupidly talked of a percentage, instead of giving an ACTUAL energy target. So, by setting the actual target high enough, KD and the like-minded rubbish the 70% plan, while others write glossy plans claiming to achieve even 80% of the target. But the target is left unsdefined! We can use KDs own data and lay bare the assumptions by considering actual targets rather than percentages.
The CEB Data For The Decade 2009-2019
Professor David uses the 2019 CEB Annul Report for his data. The Report gives the gross energy output as 16.556 TWh (terra-Watt-hours, i.e., billion-kilo-Watt-hours, a kWh is called a unit) in 2019. Thus 777 kWh of energy per person was consumed in 2019, when the population was 21.3 million.
KD launches a fantasy of 7% uninterrupted COMPOUND GROWTH claiming “a post-covid growth spike”, as seen in some countries. The “spike” reflects the massive financial injections of rich countries buttressing their business sectors. No such supportive expenditure exists in Lanka. Assuming 7% compound growth for the 11 years from 2019 to 2030 (inclusive), KD puts the total annual electrical energy needed in 2030 at 34.8 TWh. Amazingly, KD the electrical engineer has assumes steady compound growth in Lanka from 2009 to 2030 to make projections, while his Marxist double will tell us that there is no such steady growth in capitalist economies as they should show cycles of boom and bust! Which David do we doubt?
Forecasting The Next Decade
Past data can merely indicate a trend that may or may not continue. Hence forecasting is mainly a process of how several possible scenarios may evolve. We examine KD’s 7% compound growth model and several other models that are more consistent with the CEB data shown in the associated Figure.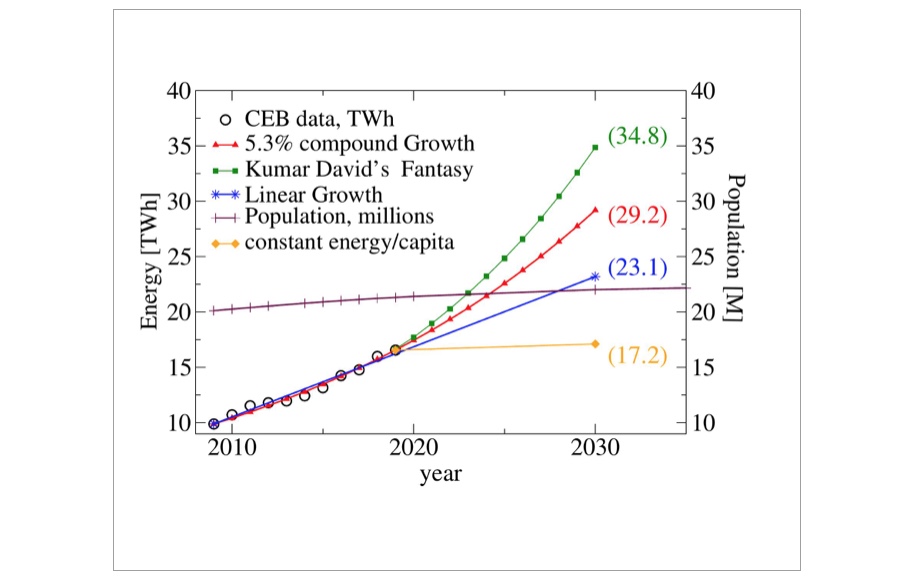
KD claims that the “normal” thing is 7% compound growth in his universe, although in the real world of Lanka it is perhaps only the DEBT of most people that is growing so fast! However, the CEB data (circles, years 2009 to 2019) show that a simple linear growth (the blue line ending up with a prediction of 23 TWh for 2030 is the best (least-square) fit to the data. Also, if compound growth were assumed, then a 5.3% growth (red line) is the best fit for the 2009-2019 period, predicting 29 TWh for 2030.
Epidemiologists predict that the Covid menace or its variants will be with us until even 2028. So it is more realistic that the demand for electricity may merely change in step with population growth, while the amount of energy consumed per annum per head (about 777kWh in 2019) will stay put. The population figure is almost “a flat curve”. The resulting “stagnation curve” predicts that in 2030, the demand for electricity would be no more than 17.2 TWh.
Professor KD looks at the pie-chart of the CEB 2019 Annual Report and proposes to “keep only two numbers” in mind: (i) all the “renewables” including Major Hydro that added to 34.8% of total production in 2019; this is 5.8 TWh, (ii) excluding major hydro, the restricted “renewals group” is 11% , that is 1.8 TWh.
Seventy percent of KD’s 34.8 is 24.4 TWh. To attain the President’s 70% target within KD’s 7% growth scenario by 2030, the renewably sourced electrical energy must jump from 5.8 TWh to 24.4 TWh! That is another 18.6 TWh. Now, KD limits all possible improvements in “renewables” only to mini-hydro+ Wind+ Solar+Bio, and asks, can you blow up this meager 2019 output of 1.8 TWh to 18 TWh by the year 2030”.
However, KD claims that, in his view, a total of 12 TWh of electrical energy generated annually from renewable sources, rather than 18 TWh is a healthy and optimistic target to aim for by year-2030. That is, adding to 16.56+(12-1.8) we get a total energy output of 26.8 TWh, i.e., well above the 23.1 TWh needed for the linear growth (blue curve in the figure) target, and close to the 29.2 TWh target for the 5.3% compounded growth rate (red curve in the figure).
That is, we ONLY need the additional 12 TWh (conceded by KD) to achieve two of the targets indicated in the figure with 100% renewable energy. Mission accomplished!
How To Achieve KD’s Target Using Only Renewals
The CEB data of the past decade do not include additional power for future electric vehicles. Furthermore, global warming will increase the demand for air conditioning. Hence, Prof. KD’s 34.8 TWh and even going beyond it become important.
The key to the solution lies in the efficient use of the hydro-electric reservoirs that we ALREADY have. According to the CEB’s pie chart for 2019, the major hydro provides only about 24% of the gross energy output.
The CEB pie chart is suspect for the following reasons. On 10th August 2020 the CEB reported that over 50% of the power came from hydro, with adequate rains. In December 2019, some 70% of the total energy needed was being met by hydro energy during a period of heavy rains. The VandeBilt University study of the Mahaweli system (Thushara de Silva et al, J. Hydrology, October 2019) also found that hydropower generation exceeds the recent 15-year average more than 70% of the time. Thus existing reservoirs have the CAPACITY to store that much more water if the water were conserved.
Reservoirs even overfills during heavy rains. Is the water efficiently used for energy production? NOT AT ALL. Excess water is released and wasted. Some 30-40% of the remaining water is lost by EVAPORATION from the reservoirs. Some 20% or more go to seepage. This happens day and night, and is most serious when the reservoirs are full. While 70% of the needed energy, i.e., 11.2 TWh could in principle be provided if reservoirs could be maintained at full capacity, the average drops to the 4.0 TWh of the CEB pie chart that may well be erroneous.
The evaporation can be largely reduced by strategically covering the most exposed parts of the reservoirs with floats. Covering even 20% of the surface has a much larger (non-linear) effect in curbing evaporation. The floating panels do not “damn the aquatic life beneath”. The death of water weeds and the arrest of aquatic hypoxia produced by the floats revive aquatic life in lakes fitted with solar panels (see Exley etal., Solar Energy, Volume 219, May 2021, Pages 24-33)
Furthermore all the water is not used for hydro-power. During the two planting seasons, agriculture over-rides power generation. However, the irrigation requirements can be halved without loss of harvest by (a) using surface floats to curb evaporation from irrigation tanks, (b) supplying only about half the water that is normally supplied for paddy where modern weed-control methods can be used instead flooding. Flooding causes soil erosion, washes away nutrients, and converts harmless forms of certain toxins (e.g., arsenic) into harmful forms.
An accurate estimate of the gain in energy output from curbing evaporation and also optimizing the fraction of water given to agriculture cannot be known without a realistic pilot project lasting, say, four planting seasons. Mathematical modeling suggests that the usual 4.0 TWh output shown in the CEB pie chart can be increased by about 8 TWh. In any case, the CEB badly needs a Power Research Institute to test these possibilities, and do innovative planning rather than unimaginatively extending yesterday’s technology to tomorrow as well.
With this addition of 8TWh obtained by efficient water management and control of evaporation, the 26.8 TWh capability now increases to 34.8 TWh,
exactly the target that Professor David found in Aesop’s fables, but with 100% renewables!
Floating Solar Panels
A part of the strategy used to gain energy output was the covering of the reservoir surfaces to curb evaporation. However, these floats can also carry solar panels.
The Mahaweli system covers some 250,000 hectares of land. The reservoirs and the adjacent land may easily provide (without litigation) 1% of the Mahaweli system, viz., about 2,500 hectares of water-surface as well as land area for the installation of solar panels. Assuming a rather modest annual energy yield of 150-200 GWh per sq. km of solar panels, some 5 TWh of energy can be generated as a lower estimate. The floating solar panels actually have a higher energy yield than land-based installations as they remain cool.
Furthermore, this energy can be stored as water above the dam by NOT sending down the equivalent amount of reservoir water into the turbines of a reservoir where there is water capacity. The solar energy generated anywhere, or for that matter wind energy, can be stored as water in a reservoir somewhere else, WITOUT INVESTMENTS IN STORAGE BATTERIES, due to grid conductivity.
However, as Professor David says, “what’s the use of wailing about all this until the brigands get their cut, or till competent and fearless technologists take control of the process”!