By ZL Mohamed –
In Sri Lanka’s 2015 Presidential Election, there was a higher turnout in electorates that favoured Mahinda Rajapaksa. Maithripala Sirisena’s surprising election victory has been explained by many on the grounds that he was supported more enthusiastically in certain regions and by certain groups and that this enthusiasm had spurred his supporters to vote in larger numbers. On the other hand, some of Rajapaksa’s supporters were supposed to be less enthusiastic and fatigued with nepotism, autocracy and corruption. For instance, Jason Burke explained Rajapakse’s loss in The Guardian of UK as “The decision to seek early polls may have been more an acknowledgement of growing unpopularity… The benefits of economic growth have failed to reach the poor, especially in rural areas.”
 However, if one studies the voter turnout and vote margins between the main contenders this notion of voters loss of enthusiasm for Mahinda appears to be contradicted. At district, and electoral units and for postal votes, there was a pattern of higher voter turnout in regions where Rajapaksa was favoured. Indeed, if voters had turned out evenly in all electorates, the lead of Sirisena over Rajapaksa would have risen from the actual 3.7% to 4.8%.
This “pattern” of higher margins in areas which favoured Mahinda had been pointed out by Dr. Laksiri Fernando and others soon after the election – below you shall find the election results analysed more comprehensively. After the election, some argued that Mahinda had lost due to voter fraud in the north and east and this claim too is reviewed in light of the skewed pattern.
This pattern could be due to benign reasons or to the role of electoral “Jilmart” (or clever trickery). Many speculated on Jilmart before the elections even the Election Commissioner tried to discount it. Let’s look at the evidence for this pattern before speculating about what may have caused this.
Mapping Voter Turnout And Margin Of Votes By District
The national average of voter turnout was 81.5%. The voter turnout ranged from 65% to 85% by district and from 41% to 85% by electorate. The war affected districts and Puttalam electorate had the lowest turnout (below 77%). The nationwide lead for Sirisena over Rajapaksa was 3.7% but it varied by district from 70% in favour of Sirisena to 30% in favour of Rajapakse. Usually, voter turnout is not related to who was ahead in the polls.
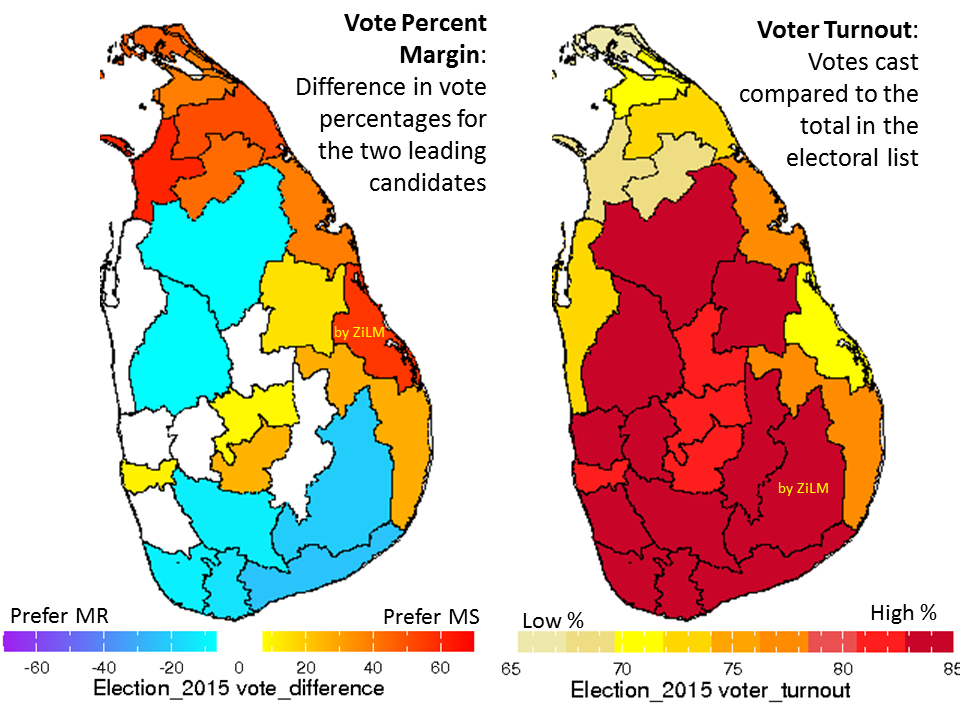
*Left –Each district is colored by the margin between the percentage of votes cast for Rajapakse and Sirisena. A higher margin for Sirisena is shown in shades of red and a higher margin for Rajapakse is shown in shades of blue. A margin of less than 7% for either candidate is left blank. Right: Voter turnout by district is shown as beige to deeper shades of red as it ranges from 65% to 85%. The data is from the Elections Department website.
From the maps, we see that the districts with higher vote margin for Rajapaksa (the bluer districts on the left) correspond to higher turnout (redder districts to the right). Conversely the districts with higher margin for Sirisena (redder districts at left) have lower voter turnout (lighter districts at right). The major exceptions are Puttalam and Polonnaruwa districts. We can look at the relationship more precisely graphically.
Charting Voter Turnout And Margin Of Votes By District
The graph here shows the vote margin and turnout for the 25 districts. The difference between the percentage of votes for the main candidates is graphed against the turnout for that district. Consider the quadrants formed by the vertical line for the average voter turnout and the horizontal line for average lead for Sirisena. The data points are distributed preferentially in the top-right (12) and bottom-left (9) quadrants with only 4 in the other two quadrants.
Puttalam is the exceptional district in the top-left quadrant – with higher favourability for Rajapaksa and lower turnout. Polonnaruwa, Colombo and Kandy are the exceptional districts in the lower-right quadrant – with higher favourability for Sirisena and higher turnout. The exceptions of Polonnaruwa and Puttalam may be explained.
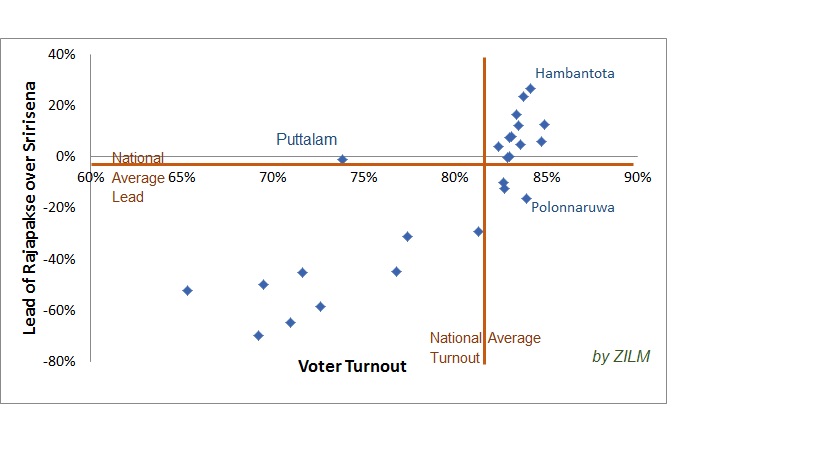 *The data points for the 25 districts shows the percentage of voters who favoured Rajapakse on the vertical axis versus the percentage turnout on the horizontal axis . The national average turnout is shown as a vertical brown line (81.5%) and the national average lead of Sirisena of 3.7% is shown as a horizontal brown line.
In Polonnaruwa, the high margin for Sirisena is because he is from there and has long tended the district. Polonnaruwa has the attributes that leads to higher voter turnout (including that Sirisena and his party were powerful leading up to the elections). This interpretation is confirmed by comparing this election with previous ones.
In Puttalam, the pattern is obscured because it has electorates which favour both candidates. Three electorates favour Rajapaksa with moderate voter turnout and one urban electorate favours Sirisena with low voter turnout. The lead is near-zero for the district even as the urban electorate dragged down the turnout for the district.
Colombo and Kandy districts do depart from this pattern but only slightly in percentage terms –these districts matter because of the large number of voters. Colombo and Kandy have a historical tendency to vote for the UNP for unrelated reasons.
One cannot attribute this pattern only to the exodus during the war in northern and eastern districts. The voter lists have already been culled after the war – the Northern Province had already lost 206,000 from the voter rolls from 988,000 in 2010 and the voter-turnout factors this in. Migration, particularly in recent years, shall be a factor but it is not the only one as we shall see.
What About The Postal Votes?
Does this pattern holds for the votes of government officers who are on elections duty? These voters are a more educated and resourced strata The postal voting took place two weeks in advance and without foreign monitors. Their turnout is higher ranging from 94 to 99%. Here too the districts with higher voter turnout did favour Rajapakse. Once again, the results for Puttalam and Polonnaruwa were anomalous.
Postal voters are essential and present workers during the elections – and thus the skewed pattern in their votes also supports the notion that immigration alone cannot explain this pattern.
What Happens At The Electoral Unit Scale?
When we compare the margins and turnout of the 160 electorates as well, we found that the skewed pattern. The electorate scale analysis adds to what we have learned at the district scale.
If the results for this Presidential election are compared to those in in 2010 and 2005, then the relative tilt toward Sirisena is dramatic for Polonnaruwa. There is a tilt for neighbouring electorates such as Seruvila in the Trincomalee district, Vavuniya in the “Wanni” district, Hingurakgoda in the Matale district and those in the Anurdhapura district.
While the district-wise data from Puttalam do not fit the skewed pattern, the margins and turnout for electorates within it does. The northern-most electorate in Puttalam favoured Sirisena substantially (by 41%) and had lower turnout (68%). Nattandiya, Anamaduwa, Wennapuwa, Chilaw voted in favour of Rajapakse while having turnout around the 70-75% range.
The turnout in Kankesanturai of 42% stands out even by Northern Province standards – all other electorates exceeded 60%. Although this district too favoured Sirisena, their must be other reasons for such a drastic drop in turnout.
Colombo and Kandy District had electorates which favoured Rajapakse although overall the district totals favour Sirisena modestly. The pattern did not hold consistently for the electorates in these district.
There were many electorates which were influenced by the features described for Polonnaruwa, Puttalam and Colombo. However, the large majority of electorates confirmed to the skewed pattern. We can check the strength of the relationship between preference for Rajapaksa and turnout with measures used by statisticians – the correlation is highly significant at the district scale and a tad stronger at electorate scale.
What If All Electorates Had Equal Turnout?
To assess the impact of the lower voter turnout on the overall lead, we can consider the hypothetical scenario of no voting disparities across districts or electorates. Under this scenario, we can estimate vote totals for each candidate, by multiplying the number of voters in the electorate, by the percentage of votes for this candidate and the national average voter turnout. In this event, the winning margin for Sirisena increases by approximately 120,000 votes. While the actual percentage margin in favour of Sirisena was 3.7%, in the hypothetical case it rises to 4.67% if the analysis is done at the district scale and to 4.8% if the analysis is done at the electoral scale. The difference is modest but if the results had been closer, uniform voter turnout alone could have flipped the outcome.
Based On The Poll Results, Enthusiasm Doesn’t Explain Sirisena’s Success
Based on the district, postal and electoral analysis, we see a consistent pattern: in regions where Rajapaksa garnered more votes there was usually higher voter turnout –the converse was true for where areas where Sirisena was favoured. This is contrary to the common belief that the Sirisena supporters were more enthusiastic and therefore likely to have turned out in greater numbers. It is hard to reconcile this belief with the election results except by invoking electoral malpractice.
However, there are good arguments against serious voting malpractice. The Elections Commissioner and staff were lauded for their independence if not their powers, were on notice and alert about malpractice and worked proactively to tamp down on possibilities of computer jilmart and to fool proof the voting process. The election monitoring groups such as CaFFE, CMEV and PAFFREL were active and registered large number of complaints particularly against the ruling party, and documented election violence and the undue exploitation of state resources (TV, bus services, vehicles) for campaigning. The JVP mobilized undergraduates in numbers to counter malpractice at the polling booth. Respected international observers travelled across the north. The Commissioner and international observers certified the elections as free and fair. Of course, all these actors and others did bemoan the inadequacy of power, protection and independence for the Commissioner and his staff and other government officials which could have affected less visible aspects of the elections. The incumbent lost here and this may be the reason why the concern about Jilmart got lost among other issues that arose since.
Since then, there are also suspicions that Rajapaksa lost due to voter fraud in the north-east and double voting by these residents in the Western CoastThe pattern found here though does undermines this argument somewhat. If there was such a concerted effort to vote twice in the North-East and on the western coast, then turnout out and voter registration should have been higher in both places – instead the opposite holds particularly in the electorates that favoured Sirisena. This argument is also weakened by the drop of 21% in the voter rolls in the Northern Province in 2015 from 2010.
The question of malpractice bears revisiting before we rule out its significance. Could it be that the electoral malpractices such as of impersonation, ballot stuffing, and fraudulent voter registration was not blatant but significant and systematic? In the fraudulent elections from Uganda in 2011 and Russia in 2011 and 2012, ballot stuffing too showed a similar skewed pattern Note, this sort of analysis cannot pick out inflation of the voter rolls which is a technique used to camouflage ballot stuffing.
Electoral malpractice may not be the only reason for such a pattern. There could be more benign reasons such as : 1. Impact of election violence, 2. Election boycott campaign in the North by some TNA members and even Rajapakse supporters, 3. Polling difficulties of displaced, refugees and temporary migrants, 4. Greater external migration from electorates opposed to Rajapaksa, 5. Apathy of those who favoured Sirisena, 6. Poorer government services (including voter registration) for these who were not favoured politically, 7. A better resourced campaign by the incumbent, 8. The fair and unfair advantages of incumbency, and 8. under-estimated voter enthusiasm for Rajapaksa. All of this warrants detailed investigation to which I hope others contribute to and help keep this issue alive as it is critical to the democratic system.
The investigations so far though does bring out the skewed pattern in voting and raising questions about electoral malpractice unless we turn the conventional wisdom of Sirisena’s enthusiastic voters on its head.
*The author, ZL Mohamed is keen to obtain polling division level voting data, other relevant data and interpretations via zilm at mail.com
Silva / May 11, 2015
Sarath reminds Mahinda about his past…
https://www.youtube.com/watch?v=Fr0PQxQ3QHQ#t=264
/
dcn / May 11, 2015
It is all money power, cheating, and deceit.
/
Amarasiri / May 11, 2015
ZL Mohamed –
RE: Higher Voter Turnout For Mahinda: Due To Enthusiasm, War Or Jilmart?
“Based on the district, postal and electoral analysis, we see a consistent pattern: in regions where Rajapaksa garnered more votes there was usually higher voter turnout –the converse was true for where areas where Sirisena was favoured. This is contrary to the common belief that the Sirisena supporters were more enthusiastic and therefore likely to have turned out in greater numbers. It is hard to reconcile this belief with the election results except by invoking electoral malpractice?”
Thank you for the analysis of the data. Decent Correlation between Rajapaksa lead and Voter turnout. What is the Correlation Coefficient?
Have you considered the distribution of money, motorcycles ad others goods as a factor for a higher turnout for Rajapaksa in those electorates, districts and postal votes?
/
Amarasiri / May 11, 2015
ZL Mohamed –
RE:Higher Voter Turnout For Mahinda: Due To Enthusiasm, War Or Jilmart?
It is generally postulated that if they only did not attack the Muslims in Nugegoda, Aluthgama, and Beruwala using BBS and Gotabaya cronies funded by Norway, Israel and he West, they could have won the elections for the Rajapakses and kept robbing Sri Lanka and her people for another 6 years.
This is Very True, and those Muslims who lost their lives, got injured, and who lost property are the Martyrs along with the thousands of others, 6, 217,162 Votes, in defeating the Medamulana Mahinda Rajapaksa Despots.
Can you recalculate the numbers assuming 80/20 and 50/50 split of the Muslim Vote for Mr Sirisena?
That is why, Amerisiri almost always refereed to Mootals, Modaysa and Fool as those who voted for Mahinda Rajapaksa, and as People With Common Sense those who voted for Mr. Mairipala Sirisena.
The LTTE Diaspora and some of the Tamils who boycotted, also fall into the Mootal, Modaya and Fools category. Do not forget, the National IQ of Sri Lanka is around 79.
The math is clear.
Mr. Maitripala Sirisena 6, 217,162 Votes
Mr. Mahinda Rajapaksa 5,768,090 Votes
Others 138,201 Votes Total Polled = 12, 123, 453 Votes
Mr. Maitripala Sirisena Majority = 449,072
Muslims = Approx 9.5% Votes = 1,151,728
With 80/20 Breakdown, for Mr. Maitripala Sirisena, he got 921,138 Votes and Mr. Mahinda Rajapaksa, 230,345 Votes.
Had this Muslim Vote be Split 50/50, Mr. Maitripala Srisena would have got 575,864 Votes =921,138-575,864 =345,274 Votes Less than he would have got, and Mr. Mahinda Rajapaksa, would have got 575,864- 230,345=345,518 votes.
Then the Results Would Have looked like, The math is clear.
Mr. Maitripala Sirisena 6, 217,162 -345,274= 5,771,888 Votes
Mr. Mahinda Rajapaksa 5,768,090 + 345,518 = 6,113,608 Votes
Others 138,201 Votes
Majority for Mr. Mahinda Rajapaksa = 6,113,608 -5,771,888 =341,720.
So, the Sinhala Buddhist Racism and Nationalism, Gotabaya Rajapaksa, BBS and Para-Sinhala Ravya, all most certainly helped Mahinda Rajapaksa’s defeat.
Let all those Martyrs who lost their lives in this struggle rest in peace.
SRI LANKA BERUWELA ALuthgama BBS Attack Minority M
https://www.youtube.com/watch?v=644ZK42sVmk
Bodu Bala Sena Aluthgama incident explained by Wimal Weerawansa.
https://www.youtube.com/watch?v=Mh_coyC2xBU
/
SLM / May 13, 2015
You have addressed the hypothetical question you have posed in the post.
Without voter-surveys we cannot know whether there was a 80/20, 50/50 or 58/42 or any other sort of split of any community. People have tried to back out the ethnicity or religion based voting percentages using the results itself but even the best of these so far (say from ArgyleX) rely on assummptions that maybe too simplistic and the details of their analysis too are unsettling (as admitted by the more careful analysts.
The second issue is if there was serious and systematic voting fraud then again all our numbers are suspect. The article was shows some evidence for such jilmart.
/
msd / May 11, 2015
Could it be the Elections Commissioner played a game on his own!!! Worth investigating
/
ZL Mohamed / May 11, 2015
Amarasiri:
The correlation at the district scale is 0.86 at the district scale. It is highly significant in a statistical sense.
Did the distribution of bikes, cash and goods help the incumbent – hard to bring out an influence from the data – especially because we dont have any data on when, what, where and to whom the distribution was made.
/
Amarasiri / May 11, 2015
ZL Mohamed
“The correlation at the district scale is 0.86 at the district scale. It is highly significant in a statistical sense.”
Yes, very significant with 0.86.
So the Rajapaksa promoters must have been more effective, with all the state resources, media, and of course al the lying and throwing a lot of other stiff around.
/
ekelbroom / May 11, 2015
@ZLM
“We can check the strength of the relationship between preference for Rajapaksa and turnout with measures used by statisticians – the correlation is highly significant at the district scale and a tad stronger at electorate scale.”
However, in general, Correlation does not imply Causation. So although the Correlation Coefficient is quite high (0.86), one cannot conclude that there is a causal relationship between Voter Turnout and Candidate Preference.
However, if two variables are Correlated, the value of one variable can be used to predict the expected value of the other.
This is how the results of your analysis could become useful in the future once the Reliability of the Method has been established.
/
ZLM / May 13, 2015
@ekelbroom
Yes, there is no causation between voter turnout and higher voting percentages. There could be something else that is driving both of these separately.
This pattern we have in Sri Lanka is similar to where there has been voter fraud before – seems you are more technically inclined so I
recommend the following scientific paper
Statistical detection of systematic election irregularities
http://www.pnas.org/content/109/41/16469.short
/
Siva Sankaran Sarma / May 12, 2015
Anyone interested in Jilmart might want to look at how the We Thamizh vote counts increased by nearly 100% in Jaffna and Vanni in just 5 years instead :D
/
R.M.B Senanayake / May 13, 2015
It is clear that the majority Sinhalese are divided . Some are out and out Sinhala Buddhist nationalists who believe in the superior claims of the Sinhala Buddhists. Unless their mindset is changed it is difficult to expect peace and equal rights for the minorities. We are sitting on top of a volcano due to explode when some racist leaders ignite the powder keg.
/
msd / May 15, 2015
If there was voter fraud that means the majority Sri Lankans have been played out which is a serious thread to democracy. This should be investigated before another election is held.
/
Professor Nazeem S / May 15, 2015
Statistics show a picture that is interesting. But, prior to the election, my analysis absed on survey (albeit very weak with only one respondent from the north!) showed the movement from Rajapakse to the opposition and vice versa. Following that indication Rajapakse would have received only 25 percentage of votes given only one respondent from the North. Jilmart or not something to think about…..uncertainty is very high and I am certain the percentage difference is so low as under 4 percentage points. I would keep this to more than 10 percentage points….
/